MIRANEST › 2026 Winners
2026 winners, from Meta
Every MIRANEST creative of ours with 10+ purchases from Jan 1 to Sep 28, 2026 — straight from Meta Ads Manager, both US ad accounts. Influencer / partner ads are on their own tab: Influencer Partner Ads Winners. Each of the 34 now has its own breakdown — why it works, the hook, the script, shot by shot — and the pattern across all 34 is below.
Why they work — the pattern all 34, creative first
| Style | Creatives | # | Purchases | Share | Per purchase | Page → buy |
|---|---|---|---|---|---|---|
| Presentera person on camera (or in a bubble) talking to the owner |       | 6 | 162 | 20% | ¥25,828 | 2.8% |
| B/A montagebefore/afters cut fast, little or no talking | 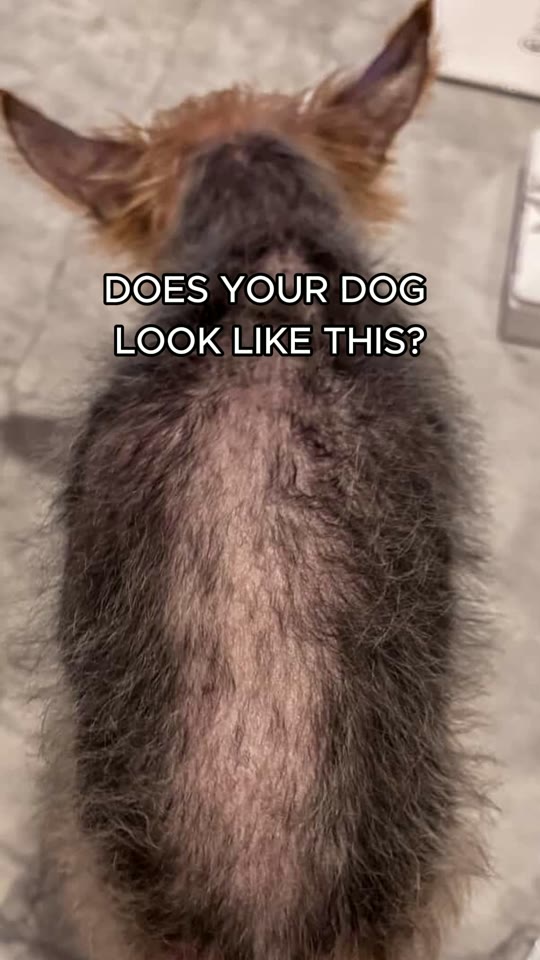 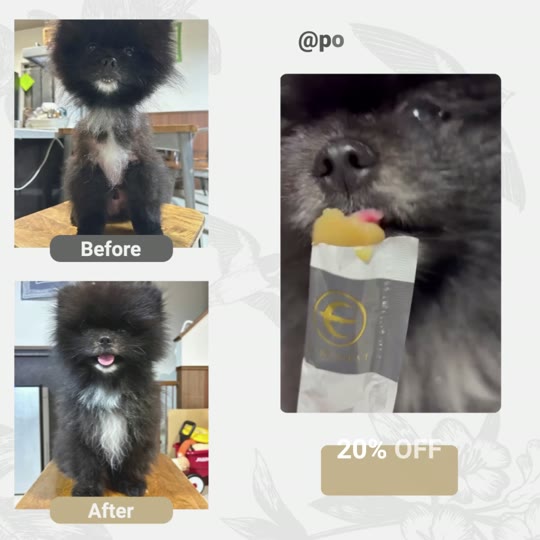    | 5 | 154 | 19% | ¥22,229 | 2.6% |
| Explainera voice explains the problem and how it works |    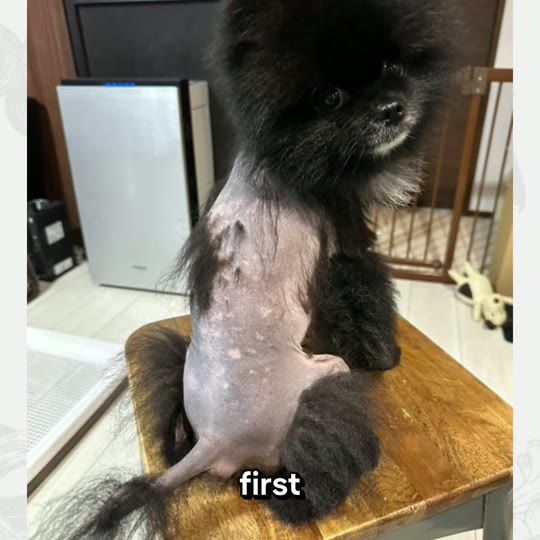  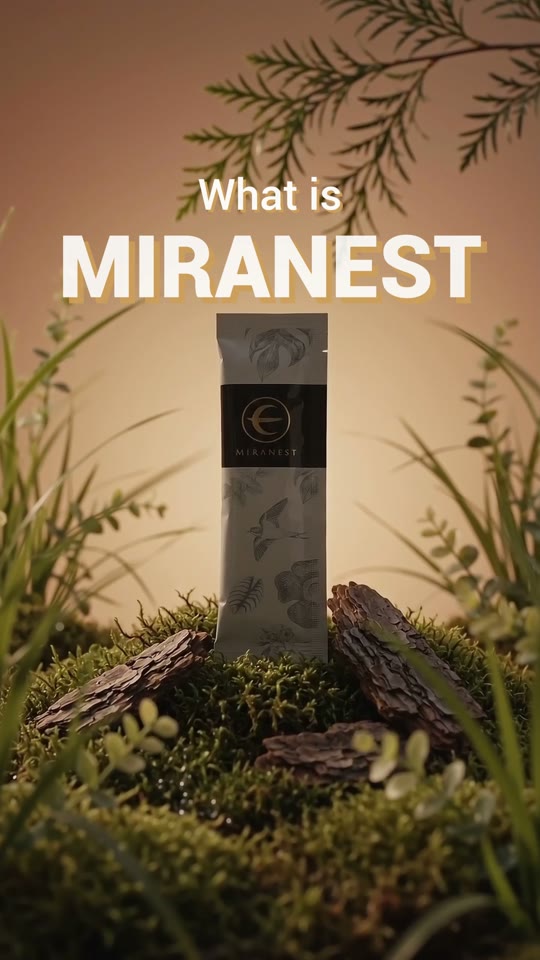 | 6 | 125 | 16% | ¥21,436 | 2.6% |
| Owner story“my dog…” told by the owner’s voice, no face | 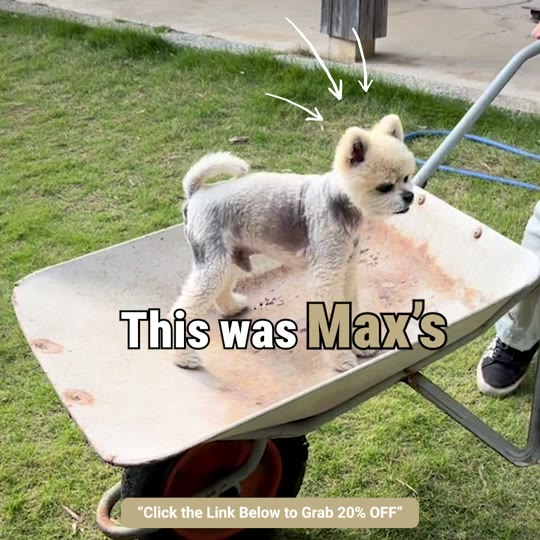    | 4 | 80 | 10% | ¥24,813 | 3.2% |
| Offerproduct + sale, no dog |     | 4 | 92 | 11% | ¥24,358 | 4.7% |
| Testimonial cardimage: quote, before photos, big after, hand holding the stick |   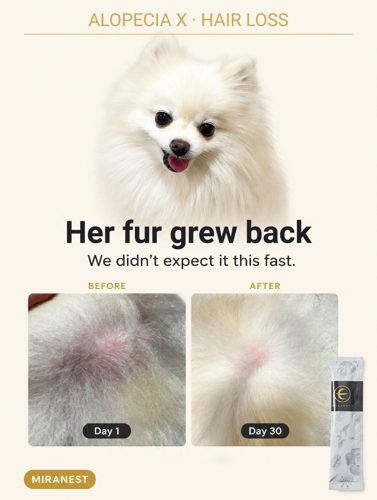  | 4 | 103 | 13% | ¥23,498 | 3.0% |
| Timelineimage: Day 1 → 60 → 180 |  | 1 | 35 | 4% | ¥33,657 | 4.3% |
| Before/after faceimage: one face, before and after | 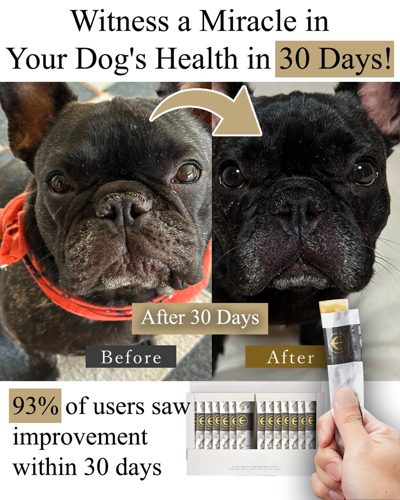 | 1 | 19 | 2% | ¥28,776 | 3.5% |
| Social postimage made to look like two posts | 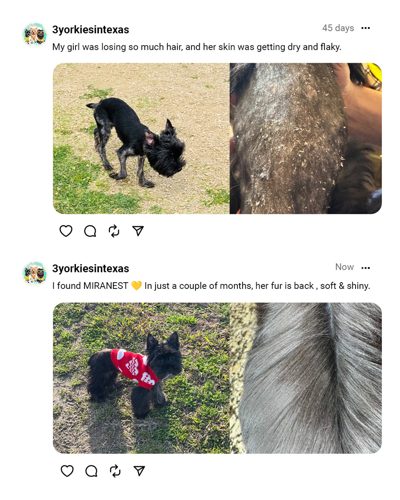 | 1 | 12 | 1% | ¥23,526 | 0.3% |
| Ingredientimage: the nest and what’s inside | 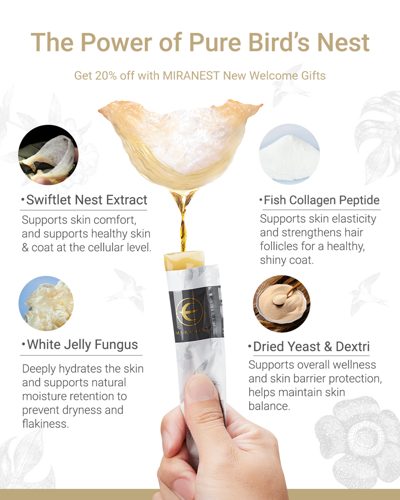  | 2 | 24 | 3% | ¥28,573 | 3.5% |
Show the change
26 of the 34 show a before/after — 654 of 806 purchases (81%). The 8 that don’t are offer, ingredient or explainer ads.
A Pomeranian
24 of 34 star a Pom (77% of purchases). The others: offer and ingredient ads with no dog, French Bulldogs on the allergy ads, one Yorkie.
No single format wins
Presenter, fast before/after, explainer, owner story, offer and image cards all made the list. What they share is the before/after and the Pom, not the format.
Re-cuts of a winner win again
324 purchases (40%) come from five families where a winner was re-cut: N164→N304-1, the #96 card→FS1020-1/F303, V39-4→V39-2→V61, V2004-1→-3, NV1002-1→-4.
Hook rate doesn’t pick winners — again
Across the 24 videos, the rank link between past-3-seconds and cost per purchase is +0.26. The two strongest hooks (V96-3 and V1012) are two of the most expensive. What does line up: page visitors who buy vs cost per purchase, -0.66.
The “vet said no cure” videos cost more
6 videos lean on it (V94-3, N165-1, V1012, V96-3, V101-1, N159-1): ¥30.8k per purchase and 2.1% page→buy, vs ¥20.6k and 3.5% for the other 18. Most of them are also over a minute long, so the line may not be the cause.
A woman’s voice, not her face
10 videos with a woman’s voiceover and no face: 238 purchases at ¥22.2k. The 4 with a woman on camera: 120 at ¥28.8k.
Offer ads convert, but bring few
The 4 no-dog offer ads have the best page→buy (4.7%; all 34 together: 2.7%) but add up to only 92 purchases — they convert the people who arrive, they don’t bring many.
Feed first, then Reels
Videos: 45% Feed, 39% Reels, 15% Stories. Images: 68% Feed. Buyers: 81% women, mostly 35–64.
Winners burst, then fade
For the typical creative here, its best month brought 68% of its 2026 purchases. #96 (8 of 9 months) and V61 (May–Sep) are the exceptions.
What to make: the build plans now have their own tab — What to make →
All 34 click a name or picture for its breakdown
| # | Creative | Format | Status | Purchases by month JFMAMJJAS | Purchases | Spend | Cost per purchase | CTR | CPM | Page → buy | Hook | |
|---|---|---|---|---|---|---|---|---|---|---|---|---|
| 1 |  | N1642 ads · 2 accounts · Apr–AugBreakdown →Drive ↗ | Video | Off | 000043121250 | 72 | ¥1.73M | ¥23,972 | 0.90% | ¥4,001 | 2.3% | 21.9% |
| 2 | 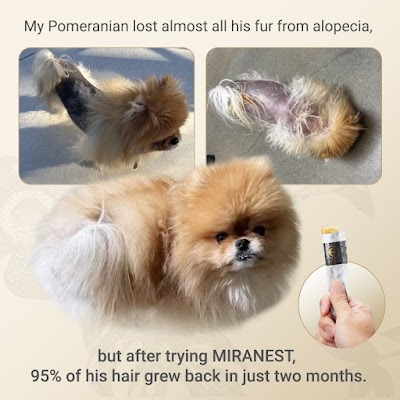 | 964 ads · Jan–SepBreakdown →Drive ↗ | Image | Off | 36464049 | 66 | ¥1.80M | ¥27,244 | 0.67% | ¥4,484 | 2.7% | — |
| 3 |  | V94-32 ads · 2 accounts · Jan–MarBreakdown →Drive ↗ | Video | Off | 15258000000 | 48 | ¥1.35M | ¥28,079 | 1.02% | ¥8,714 | 3.2% | 22.6% |
| 4 |  | N165-12 ads · 2 accounts · Apr–JulBreakdown →Drive ↗ | Video | Off | 000258300 | 38 | ¥1.02M | ¥26,872 | 1.05% | ¥4,431 | 1.9% | 27.6% |
| 5 |  | V39-24 ads · Apr–AugBreakdown →Drive ↗ | Video | Off | 000020130 | 35 | ¥768k | ¥21,929 | 0.42% | ¥3,405 | 5.2% | 9.5% |
| 6 |  | 1771 ad · Jan–MarBreakdown →Drive ↗ | Image | Off | 294000000 | 35 | ¥1.18M | ¥33,657 | 0.51% | ¥7,178 | 4.3% | — |
| 7 |  | V10121 ad · Mar–AprBreakdown →Drive ↗ | Video | Off | 0030300000 | 33 | ¥1.15M | ¥34,771 | 0.67% | ¥5,888 | 2.5% | 30.0% |
| 8 |  | V1-74 ads · 2 accounts · Jan–MayBreakdown →Drive ↗ | Video | Off | 243400000 | 32 | ¥622k | ¥19,437 | 0.83% | ¥4,724 | 3.3% | 15.9% |
| 9 |  | V35-31 ad · Jan–FebBreakdown →Drive ↗ | Video | Off | 2650000000 | 31 | ¥547k | ¥17,641 | 1.18% | ¥9,581 | 4.9% | 20.4% |
| 10 | 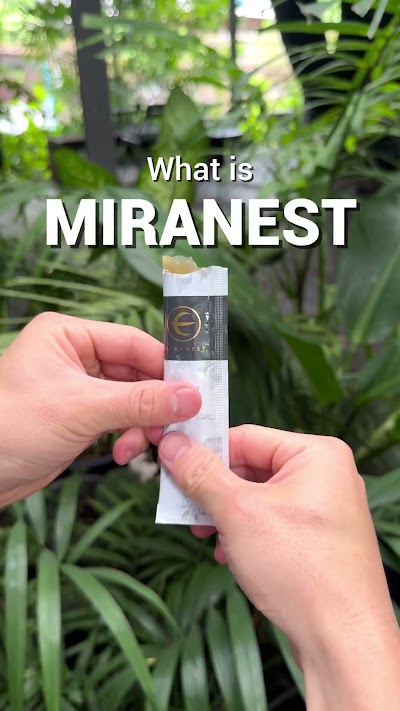 | NV1002-11 ad · Aug–SepBreakdown →Drive ↗ | Video | Live | 00000001313 | 26 | ¥464k | ¥17,861 | 0.80% | ¥5,789 | 4.6% | 16.5% |
| 11 |  | F021 ad · Jun–SepBreakdown →Drive ↗ | Video | Live | 00000001511 | 26 | ¥542k | ¥20,843 | 0.94% | ¥4,849 | 2.8% | 21.0% |
| 12 |  | F031 ad · Jun–SepBreakdown →Drive ↗ | Video | Off | 0000002140 | 25 | ¥287k | ¥11,487 | 0.87% | ¥4,932 | 5.5% | 18.7% |
| 13 |  | N173-11 ad · May–JulBreakdown →Drive ↗ | Video | Off | 0000615400 | 25 | ¥481k | ¥19,228 | 0.88% | ¥4,934 | 3.4% | 27.8% |
| 14 | 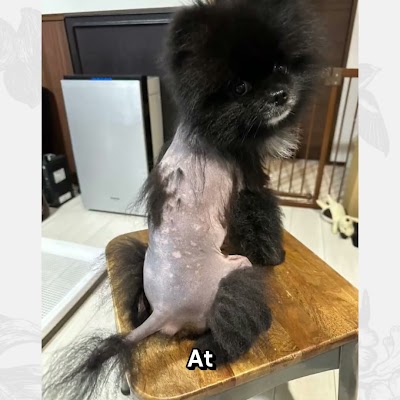 | V96-35 ads · 2 accounts · Jan–AprBreakdown →Drive ↗ | Video | Off | 910500000 | 25 | ¥822k | ¥32,873 | 1.05% | ¥4,956 | 1.5% | 30.2% |
| 15 |  | V2004-31 ad · Aug–SepBreakdown →Drive ↗ | Video | Live | 00000001212 | 24 | ¥393k | ¥16,381 | 0.86% | ¥5,259 | 4.3% | 22.1% |
| 16 |  | V613 ads · May–SepBreakdown →Drive ↗ | Video | Live | 00007663 | 24 | ¥676k | ¥28,149 | 0.43% | ¥3,487 | 3.7% | 9.3% |
| 17 |  | V543 ads · Feb–AprBreakdown →Drive ↗ | Video | Off | 0101200000 | 24 | ¥790k | ¥32,928 | 1.61% | ¥12,899 | 2.4% | 25.3% |
| 18 | | 52 ads · Jan–AprBreakdown → | Image | Off | 180000000 | 19 | ¥547k | ¥28,776 | 1.59% | ¥16,036 | 3.5% | — |
| 19 |  | V39-41 ad · Jan–AprBreakdown →Drive ↗ | Video | Off | 0012500000 | 17 | ¥318k | ¥18,695 | 0.64% | ¥7,814 | 7.8% | 12.8% |
| 20 | 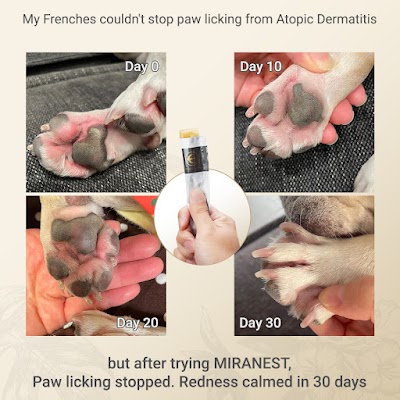 | F3031 ad · Jun–AugBreakdown →Drive ↗ | Image | Off | 00000690 | 16 | ¥191k | ¥11,944 | 0.79% | ¥4,063 | 5.1% | — |
| 21 |  | 189-12 ads · Apr–MayBreakdown →Drive ↗ | Image + Video | Off | 000150000 | 16 | ¥480k | ¥30,002 | 0.53% | ¥4,742 | 3.7% | 2.7% |
| 22 | | R9.13 ads · Feb–MayBreakdown → | Image | Off | 00570000 | 14 | ¥387k | ¥27,661 | 0.98% | ¥10,260 | 4.4% | — |
| 23 |  | V101-11 ad · Jan–FebBreakdown →Drive ↗ | Video | Off | 130000000 | 14 | ¥541k | ¥38,675 | 1.07% | ¥4,376 | 1.1% | 13.2% |
| 24 |  | V2004-11 ad · Jul–SepBreakdown →Drive ↗ | Video | Off | 00000011 | 13 | ¥198k | ¥15,204 | 0.88% | ¥5,268 | 4.5% | 27.7% |
| 25 |  | N241 ad · Jun–JulBreakdown →Drive ↗ | Video | Off | 000008500 | 13 | ¥339k | ¥26,074 | 0.77% | ¥4,532 | 2.6% | 18.4% |
| 26 | 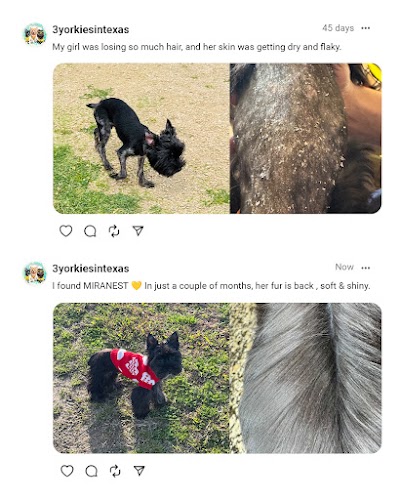 | 946 ads · 2 accounts · Jan–MayBreakdown →Drive ↗ | Image | Off | 450000 | 12 | ¥282k | ¥23,526 | 5.37% | ¥3,847 | 0.3% | — |
| 27 |  | V78-43 ads · Jan–MarBreakdown →Drive ↗ | Video | Off | 9000000 | 11 | ¥181k | ¥16,499 | 0.55% | ¥4,972 | 5.2% | 12.0% |
| 28 |  | N304-11 ad · Aug–SepBreakdown →Drive ↗ | Video | Off | 000000010 | 11 | ¥194k | ¥17,678 | 0.98% | ¥5,743 | 3.7% | 22.2% |
| 29 | 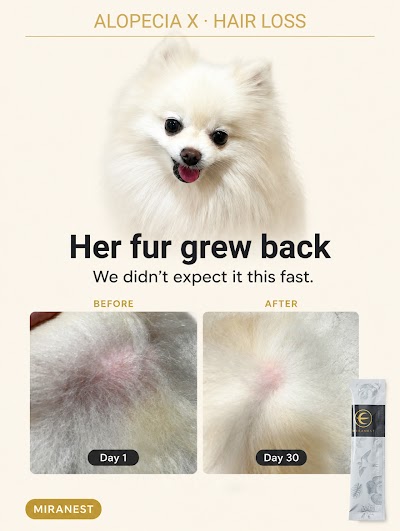 | F2691 ad · May–AugBreakdown →Drive ↗ | Image | Off | 000070 | 11 | ¥247k | ¥22,432 | 0.67% | ¥3,357 | 2.8% | — |
| 30 | 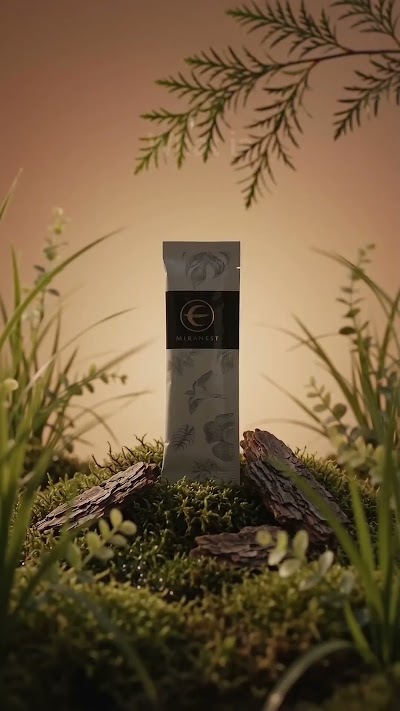 | NV1002-41 ad · Aug–SepBreakdown →Drive ↗ | Video | Live | 00000009 | 10 | ¥84k | ¥8,398 | 0.86% | ¥3,482 | 7.0% | 5.4% |
| 31 |  | FS1020-11 ad · Aug–SepBreakdown →Drive ↗ | Image | Live | 000000037 | 10 | ¥184k | ¥18,439 | 0.75% | ¥3,866 | 3.4% | — |
| 32 |  | N1841 ad · Jun–AugBreakdown →Drive ↗ | Video | Off | 000000730 | 10 | ¥247k | ¥24,676 | 0.72% | ¥4,513 | 3.1% | 18.1% |
| 33 |  | N159-11 ad · Apr–MayBreakdown →Drive ↗ | Video | Off | 0001000000 | 10 | ¥297k | ¥29,656 | 0.99% | ¥7,035 | 2.6% | 21.0% |
| 34 | | R10.11 ad · Feb–FebBreakdown → | Image | Off | 0100000000 | 10 | ¥299k | ¥29,850 | 0.40% | ¥3,144 | 2.7% | — |
Meta Ads Manager export, read 2026-09-29 · accounts “ミラネスト アメリカ” and “ミラネスト アメリカ_2” · Jan 1 – Sep 28, 2026 · purchases = website purchases under each ad set’s attribution setting (Meta changed click attribution on Mar 17, 2026, so Jan–Mar and later months aren’t perfectly comparable) · ads with the same creative name are added together, across ads and accounts · cost per purchase: green under ¥25k, orange ¥25–35k, red over Boss AI’s ¥35k line · page → buy = purchases ÷ landing-page views · hook = 3-second plays ÷ impressions (videos) · status = Live if any of its ads is active today · thumbnails and Drive links: files found in Drive by name